Page 32 - PET worldwide issue 1/2021
P. 32

Distribution


                                      Zooplus sets high


                                      growth targets


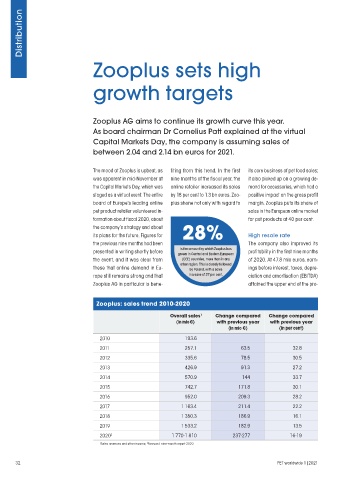
                                      Zooplus AG aims to continue its growth curve this year.
                                      As board chairman Dr Cornelius Patt explained at the virtual

                                      Capital Markets Day, the company is assuming sales of
                                      between 2.04 and 2.14 bn euros for 2021.


                                      The mood at Zooplus is upbeat, as   fiting from this trend. In the first   its core business of pet food sales;
                                      was apparent in mid-November at   nine months of the fiscal year, the   it also picked up on a growing de-
                                      the Capital Markets Day, which was   online retailer increased its sales   mand for accessories, which had a
                                      staged as a virtual event. The entire   by 18 per cent to 1.3 bn euros. Zoo-  positive impact on the gross profit
                                      board of Europe’s leading online   plus shone not only with regard to   margin. Zooplus puts its share of
                                      pet product retailer volunteered in-                   sales in the European online market
                                      formation about fiscal 2020, about                     for pet products at 40 per cent.
                                      the company’s strategy and about   28%
                                      its plans for the future. Figures for                  High resale rate
                                      the previous nine months had been                      The company also improved its
                                                                     is the amount by which Zooplus has
                                      presented in writing shortly before   grown in Central and Eastern European    profitability in the first nine months
                                      the event, and it was clear from   (CEE) countries, more than in any    of 2020. At 47.8 mio euros, earn-
                                                                     other region. This is closely followed
                                      these that online demand in Eu-   by Poland, with a sales    ings before interest, taxes, depre-
                                      rope still remains strong and that   increase of 27 per cent.  ciation and amortisation (EBITDA)
                                      Zooplus AG in particular is bene-                      attained the upper end of the pro-


                                       Zooplus: sales trend 2010-2020

                                                                            1
                                                                  Overall sales    Change compared   Change compared
                                                                   (in mio €)    with previous year   with previous year
                                                                                      (in mio €)       (in per cent)
                                        2010                          193.6
                                        2011                          257.1               63.5              32.8
                                        2012                          335.6               78.5              30.5
                                        2013                          426.9               91.3              27.2
                                        2014                          570.9               144               33.7

                                        2015                          742.7              171.8              30.1
                                        2016                          952.0              209.3              28.2
                                        2017                         1 163.4             211.4              22.2
                                        2018                         1 350.3             186.9              16.1
                                        2019                         1 533.2             182.9              13.5
                                        2020 2                    1 770-1 810          237-277             16-19
                                        1 Sales revenues and other income;  2 Forecast. nine-month report 2020


           32                                                                                          PET worldwide 1|2021


       PWW2021-01_Buch.indb   32                                                                                12.02.2021   13:03:56
   27   28   29   30   31   32   33   34   35   36   37