
Page 22 - PET2021-09_Sonderbeilage_Zoo_und_Co.indd
P. 22
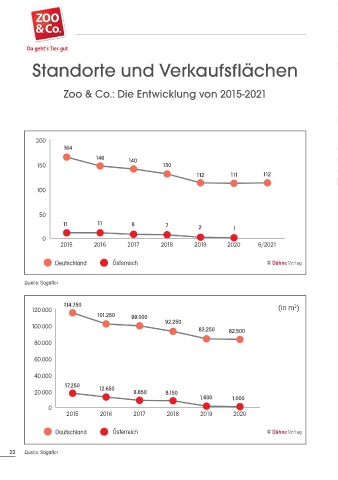
Standorte und Verkaufsflächen
                    %40
                     Zoo & Co.: Die Entwicklung von 2015-2021


              200
                     164
                             146     140
              150                             130
                                                      112     111      112

              100

               50
                     11      11       8       7        2       1
                0
                    2015
                    %40      2016    2017    2018     2019    2020   6/2021
                   Deutschland   Österreich

           Quelle: Sagaflor

                     114.750                                                  2
             120.000                                                      (in m )
                             101.250  99.000
                                              92.250
             100.000
                                                       83.250  82.500
              80.000

              60.000
              40.000
                     17.250
              20.000          12.650  8.650   8.150
                                                                                           © Javier brosch – stock.adobe.com
                                                       1.600   1.000
                 0
                      2015    2016    2017     2018    2019    2020
                   Deutschland   Österreich

        22  Quelle: Sagaflor


       PET2021-09_Sonderbeilage_Zoo_und_Co.indd   22                         24.08.2021   14:11:04